Every January starts the same: LP sentiment surveys tick up, dealmakers get excited, and everyone agrees this is finally the year the industry recovers. Then something happens: rate hikes in 2022; Silicon Valley Bank in 2023; election uncertainty in 2024; Liberation Day tariffs in 2025. As Ontra’s CEO, Troy Pospisil, put it during a webinar with Bain & Company’s Hugh MacArthur, it’s “a collective sense that this is the year,” followed by yet another letdown.
In June, Bain & Company’s 2026 Private Equity Midyear Report cited our inaugural Market Index Report in concluding the market was flat, with a broad-based recovery “still to emerge.”
Our mid-year update changes that.
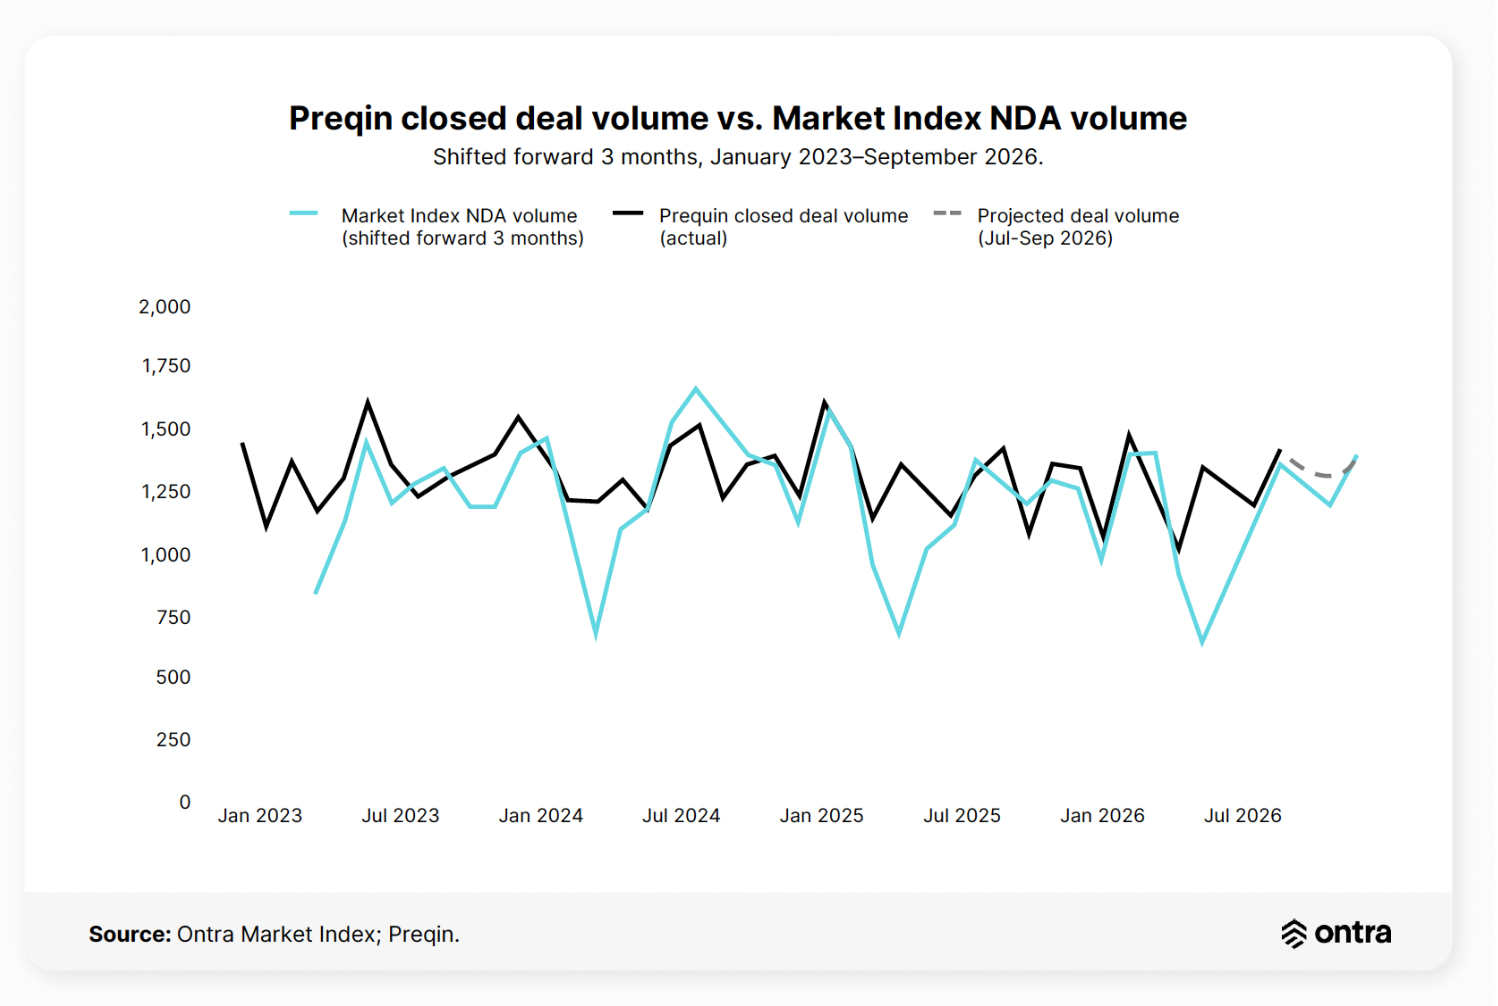
Our latest analysis shows that NDA volume jumped 7.2% year over year in June, the first month above seasonal norms in 17 months, and our model projects third-quarter deal volume up 3.2%. That would mark the first back-to-back quarters of deal volume growth in the Market Index’s 39-month history.
The recovery is led by the firms and markets with the least cushion
The composition of the rebound is arguably an even more interesting story.
Smaller firms, the bottom 80% of the Market Index by NDA volume, grew volume 4.8% year over year in the first half of 2026, compared with 1.4% for the largest firms. The gap widened during the oil-shock months, when smaller firms posted gains as high as 12.0% while larger firms hovered near zero. Markets outside the United States grew NDA volume 11.4% in the first half, versus 0.9% domestically. By June, every cohort the Market Index tracks, by firm size and by geography, was growing year over year for the first time in 2026.
One European private credit fund told us that NDA volume is running more than 40% ahead of 2025 levels. A deal professional at a mid-market private equity firm said NDA volume was running 15% ahead of the prior 12 months, with nearly every month this year outpacing the same month a year ago. Meanwhile, another deal professional on a global asset manager’s Asia-Pacific team described overall deal activity as still catching up to expectations, but pointed to a specific uptick in NDA requests from Australia—one thread in the international growth the Market Index is showing broadly.
That breadth matters because the closed-deal data investors actually see tells a more concentrated story: sponsors have leaned into fewer, larger transactions in 2026, with mega-deals driving a growing share of total deal value. Our earlier-stage NDA data suggests the base of deal intent is widening well before it shows up in a mega-deal-weighted closing statistic.
Two shocks, two different recoveries
The Market Index has lived through two macro shocks, and the contrast between them is the clearest evidence of a genuine turn.
When the April 2025 Liberation Day tariffs hit, NDA volume fell to a trough 22% below the prior year within weeks, and the drag did not let up: monthly volume stayed negative year over year for 13 straight months. Dealmakers paused, then stayed cautious for the better part of a year.
The late-February 2026 Iran oil shock looked, on paper, at least as severe: oil prices spiked more than 50% within weeks as the Strait of Hormuz came under threat. Yet NDA volume never dipped more than 0.6% below the prior year from February through May, and by June it had swung to growth of 7.2% year over year, the strongest print since October 2025. Dealmakers, it turns out, have learned how to build shock absorbers.
A leading indicator that’s proven its case
MacArthur put it plainly: “The pace of NDAs has historically been a good long-term predictor of where the market is going.”
Our track record backs him up. Our inaugural report projected Q1 2026 deal volume roughly 5% below the prior year; the realized figure came in at -6.4%, within about a point and in the right direction. The Q2 2026 estimate landed within 0.1% of realized volume.
Bain’s own Midyear 2026 report describes a recovery braked by a “triple-shock” that left activity close to flat through the first half of the year. That is not a contradiction of what the Market Index shows; it is confirmation of the lag. Our NDA data was already inflecting upward in June, a full quarter ahead of when that improvement will show up in the closing data everyone else is reading.
The takeaway
None of this means private equity’s problems are solved. In that webinar with Proposil, MacArthur was direct about the industry’s liquidity crisis: roughly 40% of the industry’s 32,000 portfolio companies have been held for more than five years, and distributions have run below 14% of paid-in capital for four consecutive years, well under the 20 to 30% GPs have historically returned. He also described a K-shaped fundraising market in which 20-40% of GPs may struggle to raise their next fund.
But our Market Index would indicate the recovery is real—albeit still measured rather than exuberant—broader across firm size and geography than the headlines suggest, and visible in NDA data before it shows up anywhere else.
Download the full Mid-Year 2026 Market Index Report for the complete cohort breakdowns, forecasting methodology, and Q3 2026 outlook.